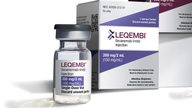
biogen inc. - BIIB

BIIB

Close Chg Chg %
131.32 -0.61 -0.46%

Pre-Market

130.71

-0.61 (0.46%)

Volume: 1.76M

Last Updated:

Apr 3, 2025, 4:00 PM EDT

Company Overview: biogen inc. - BIIB

BIIB Key Data

Open

$132.37

Day Range

130.08 - 133.77

52 Week Range

128.51 - 237.98

Market Cap

$19.22B

Shares Outstanding

146.38M

Public Float

145.63M

Beta

0.06

Rev. Per Employee

N/A

P/E Ratio

11.74

EPS

$11.22

Yield

0.00%

Dividend

$22.23

EX-DIVIDEND DATE

Feb 2, 2017

SHORT INTEREST

N/A

AVERAGE VOLUME

1.76M


BIIB Performance

1 Week
 
-5.54%
 
1 Month
 
-13.08%
 
3 Months
 
-14.13%
 
1 Year
 
-35.89%
 
5 Years
 
-56.50%
 

BIIB Analyst Ratings

  • Sell
  • Under
  • Hold
  • Over
  • Buy
Number of Ratings 36
Full Ratings ➔

About biogen inc. - BIIB

Biogen, Inc. is a biopharmaceutical company, which engages in discovering, developing, and delivering therapies for neurological and neurodegenerative diseases. Its products include TECFIDERA, VUMERITY, AVONEX, PLEGRIDY, TYSABRI and FAMPYRA for the treatment of MS, SPINRAZA for the treatment of SMA, ADUHELM for the treatment of Alzheimer's disease, and FUMADERM for the treatment of severe plaque psoriasis. The company was founded by Charles Weissmann, Heinz Schaller, Kenneth Murray, Walter Gilbert, and Phillip Allen Sharp in 1978 and is headquartered in Cambridge, MA.

BIIB At a Glance

Biogen, Inc.
225 Binney Street
Cambridge, Massachusetts 02142
Phone 1-617-679-2000 Revenue 9.27B
Industry Pharmaceuticals: Major Net Income 1.63B
Sector Health Technology Employees 7,605
Fiscal Year-end 12 / 2025
View SEC Filings

BIIB Valuation

P/E Current 11.739
P/E Ratio (with extraordinary items) N/A
P/E Ratio (without extraordinary items) 13.669
Price to Sales Ratio 2.408
Price to Book Ratio 1.334
Price to Cash Flow Ratio 7.759
Enterprise Value to EBITDA 9.528
Enterprise Value to Sales 2.876
Total Debt to Enterprise Value 0.252

BIIB Efficiency

Revenue/Employee 1,218,487.837
Income Per Employee 214,621.959
Receivables Turnover 4.959
Total Asset Turnover 0.338

BIIB Liquidity

Current Ratio 1.349
Quick Ratio 0.904
Cash Ratio 0.43

BIIB Profitability

Gross Margin 67.803
Operating Margin 22.923
Pretax Margin 20.568
Net Margin 17.614
Return on Assets 5.947
Return on Equity 10.358
Return on Total Capital 6.965
Return on Invested Capital 7.49

BIIB Capital Structure

Total Debt to Total Equity 40.181
Total Debt to Total Capital 28.664
Total Debt to Total Assets 23.946
Long-Term Debt to Equity 29.204
Long-Term Debt to Total Capital 20.833
  • Income Statement
  • Balance Sheet
  • Cash Flow Statement

Annual Financials for Biogen Inc. - BIIB

Collapse All in section
All values USD millions. 2021 2022 2023 2024 5-year trend
Sales/Revenue
10.40B 9.43B 9.42B 9.27B
Sales Growth
-15.81% -9.32% -0.17% -1.60%
Cost of Goods Sold (COGS) incl D&A
2.60B 2.80B 3.03B 2.98B
COGS excluding D&A
- - - -
-
Depreciation & Amortization Expense
487.30M 518.70M 494.80M 673.20M
Depreciation
235.30M 272.40M 254.20M 286.70M
Amortization of Intangibles
252.00M 246.30M 240.60M 386.50M
COGS Growth
+14.80% +7.70% +8.27% -1.47%
Gross Income
7.81B 6.64B 6.39B 6.28B
Gross Income Growth
-22.67% -14.98% -3.73% -1.66%
Gross Profit Margin
+75.03% +70.35% +67.84% +67.80%
2021 2022 2023 2024 5-year trend
SG&A Expense
4.94B 4.36B 4.76B 4.16B
Research & Development
2.27B 1.96B 2.21B 1.76B
Other SG&A
2.67B 2.40B 2.55B 2.40B
SGA Growth
-21.50% -11.70% +9.06% -12.58%
Other Operating Expense
- - - -
-
Unusual Expense
648.30M 1.01B 217.40M 69.20M
EBIT after Unusual Expense
2.22B 1.27B 1.41B 2.06B
Non Operating Income/Expense
(218.10M) 2.57B 129.80M 101.30M
Non-Operating Interest Income
11.00M 89.30M 276.50M 67.60M
Equity in Earnings of Affiliates
640.50M 554.40M 190.60M 137.60M
Interest Expense
253.60M 246.60M 246.90M 250.30M
Interest Expense Growth
+12.31% -2.76% +0.12% +1.38%
Gross Interest Expense
289.90M 263.70M 268.60M 253.50M
Interest Capitalized
36.30M 17.10M 21.70M 3.20M
Pretax Income
1.75B 3.59B 1.30B 1.91B
Pretax Income Growth
-65.42% +105.81% -63.90% +46.98%
Pretax Margin
+16.78% +38.08% +13.77% +20.57%
Income Tax
52.50M 632.80M 135.30M 273.80M
Income Tax - Current - Domestic
342.20M 733.50M 392.70M 499.40M
Income Tax - Current - Foreign
137.10M 67.90M 48.40M (67.50M)
Income Tax - Deferred - Domestic
(254.40M) (325.80M) (600.10M) (171.80M)
Income Tax - Deferred - Foreign
(172.40M) 157.20M 294.30M 13.70M
Income Tax Credits
- - - -
-
Equity in Earnings of Affiliates
640.50M 554.40M 190.60M 137.60M
Other After Tax Income (Expense)
- - - -
-
Consolidated Net Income
1.73B 2.96B 1.16B 1.63B
Minority Interest Expense
- 171.50M (85.30M) 400.00K
Net Income
1.56B 3.05B 1.16B 1.63B
Net Income Growth
-61.10% +95.80% -61.89% +40.57%
Net Margin Growth
+14.96% +32.30% +12.33% +17.61%
Extraordinaries & Discontinued Operations
- - - -
-
Discontinued Operations
- - - -
-
Net Income After Extraordinaries
1.56B 3.05B 1.16B 1.63B
Preferred Dividends
- - - -
-
Net Income Available to Common
1.56B 3.05B 1.16B 1.63B
EPS (Basic)
10.4366 20.9697 8.0242 11.2102
EPS (Basic) Growth
-58.03% +100.92% -61.73% +39.70%
Basic Shares Outstanding
149.10M 145.30M 144.70M 145.60M
EPS (Diluted)
10.4017 20.8692 7.9746 11.1871
EPS (Diluted) Growth
-58.06% +100.63% -61.79% +40.28%
Diluted Shares Outstanding
149.60M 146.00M 145.60M 145.90M
EBITDA
3.35B 2.79B 2.13B 2.80B
EBITDA Growth
-21.25% -16.70% -23.87% +31.57%
EBITDA Margin
+32.23% +29.61% +22.58% +30.19%

Snapshot

Average Recommendation OVERWEIGHT Average Target Price 194.25
Number of Ratings 36 Current Quarters Estimate 4.068
FY Report Date 06 / 2025 Current Year's Estimate 15.93
Last Quarter’s Earnings 3.65 Median PE on CY Estimate N/A
Year Ago Earnings 16.47 Next Fiscal Year Estimate 15.746
Median PE on Next FY Estimate N/A

Earnings Per Share

This Quarter Next Quarter This Fiscal Next Fiscal
# of Estimates 24 24 29 25
Mean Estimate 4.07 4.08 15.93 15.75
High Estimates 4.82 4.66 20.14 18.73
Low Estimate 3.73 3.53 15.07 12.03
Coefficient of Variance 5.20 7.57 5.47 9.38

Analysts Recommendations

Current 1 Month Ago 3 Months Ago
BUY 15 15 17
OVERWEIGHT 2 2 2
HOLD 19 19 18
UNDERWEIGHT 0 0 0
SELL 0 0 0
MEAN Overweight Overweight Overweight

Insider Actions for Biogen Inc. - BIIB

Date Name Shares Transaction Value
Mar 11, 2025 Stephen A. Sherwin Director 11,318 Open market or private sale of non-derivative or derivative security Non-derivative transaction at $150.02 per share 1,697,926.36
Feb 13, 2025 Rachid Izzar Head of Global Product Strat. 8,553 Payment of exercise price or tax liability by delivering/withholding secs incident to the receipt/exercise/vesting pursuant to Rule 16b-3 Non-derivative transaction at $142.54 per share 1,219,144.62
Feb 13, 2025 Robin C. Kramer Chief Accounting Officer 8,012 Payment of exercise price or tax liability by delivering/withholding secs incident to the receipt/exercise/vesting pursuant to Rule 16b-3 Non-derivative transaction at $142.54 per share 1,142,030.48
Feb 13, 2025 Robin C. Kramer Chief Accounting Officer 8,257 Exercise or conversion of derivative security exempted pursuant to Rule 16b-3 0.00
Feb 13, 2025 Robin C. Kramer Chief Accounting Officer N/A Exercise or conversion of derivative security exempted pursuant to Rule 16b-3 0.00
Feb 13, 2025 Rachid Izzar Head of Global Product Strat. 8,998 Exercise or conversion of derivative security exempted pursuant to Rule 16b-3 0.00
Feb 13, 2025 Ginger Gregory EVP, Human Resources N/A Exercise or conversion of derivative security exempted pursuant to Rule 16b-3 0.00
Feb 13, 2025 Ginger Gregory EVP, Human Resources 17,598 Payment of exercise price or tax liability by delivering/withholding secs incident to the receipt/exercise/vesting pursuant to Rule 16b-3 Non-derivative transaction at $142.54 per share 2,508,418.92
Feb 13, 2025 Ginger Gregory EVP, Human Resources 18,232 Exercise or conversion of derivative security exempted pursuant to Rule 16b-3 0.00
Feb 13, 2025 Priya Singhal Head of Development N/A Exercise or conversion of derivative security exempted pursuant to Rule 16b-3 0.00
Feb 13, 2025 Priya Singhal Head of Development 9,066 Payment of exercise price or tax liability by delivering/withholding secs incident to the receipt/exercise/vesting pursuant to Rule 16b-3 Non-derivative transaction at $142.54 per share 1,292,267.64
Feb 13, 2025 Priya Singhal Head of Development 9,423 Exercise or conversion of derivative security exempted pursuant to Rule 16b-3 0.00
Feb 13, 2025 Susan H. Alexander EVP Chief Legal Officer N/A Exercise or conversion of derivative security exempted pursuant to Rule 16b-3 0.00
Feb 13, 2025 Susan H. Alexander EVP Chief Legal Officer 36,265 Payment of exercise price or tax liability by delivering/withholding secs incident to the receipt/exercise/vesting pursuant to Rule 16b-3 Non-derivative transaction at $142.54 per share 5,169,213.10
Feb 13, 2025 Susan H. Alexander EVP Chief Legal Officer 37,072 Exercise or conversion of derivative security exempted pursuant to Rule 16b-3 0.00
Feb 13, 2025 Rachid Izzar Head of Global Product Strat. N/A Exercise or conversion of derivative security exempted pursuant to Rule 16b-3 0.00
Feb 13, 2025 Nicole Murphy Head of Pharm Ops and Tech 14,725 Exercise or conversion of derivative security exempted pursuant to Rule 16b-3 0.00
Feb 13, 2025 Michael R. McDonnell EVP, Chief Financial Officer N/A Exercise or conversion of derivative security exempted pursuant to Rule 16b-3 0.00
Feb 13, 2025 Michael R. McDonnell EVP, Chief Financial Officer 24,341 Payment of exercise price or tax liability by delivering/withholding secs incident to the receipt/exercise/vesting pursuant to Rule 16b-3 Non-derivative transaction at $142.54 per share 3,469,566.14
Feb 13, 2025 Michael R. McDonnell EVP, Chief Financial Officer 25,712 Exercise or conversion of derivative security exempted pursuant to Rule 16b-3 0.00

Biogen Inc. in the News