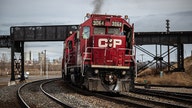
canadian pacific kansas city ltd. - CP

CP

Close Chg Chg %
71.07 1.18 1.66%

Closed Market

72.25

+1.18 (1.66%)

Volume: 3.69M

Last Updated:

Dec 20, 2024, 3:59 PM EDT

Company Overview: canadian pacific kansas city ltd. - CP

CP Key Data

Open

$70.96

Day Range

70.90 - 72.81

52 Week Range

70.90 - 91.55

Market Cap

$66.36B

Shares Outstanding

933.35M

Public Float

933.12M

Beta

0.96

Rev. Per Employee

N/A

P/E Ratio

25.55

EPS

$2.79

Yield

78.54%

Dividend

$0.14

EX-DIVIDEND DATE

Dec 27, 2024

SHORT INTEREST

N/A

AVERAGE VOLUME

3.42M


CP Performance

1 Week
 
-4.40%
 
1 Month
 
-7.29%
 
3 Months
 
-17.19%
 
1 Year
 
-10.53%
 
5 Years
 
40.32%
 

CP Analyst Ratings

  • Sell
  • Under
  • Hold
  • Over
  • Buy
Number of Ratings 32
Full Ratings ➔

About canadian pacific kansas city ltd. - CP

Canadian Pacific Kansas City Ltd. engages in the provision of rail freight transportation services. It offers rail services linking Canada, the United States and Mexico. The company was founded on June 22, 2001, and is headquartered in Calgary, Canada.

CP At a Glance

Canadian Pacific Kansas City Ltd.
7550 Ogden Dale Road Southeast
Calgary, Alberta T2C 4X9
Phone 1-888-333-6370 Revenue 9.30B
Industry Railroads Net Income 2.91B
Sector Transportation 2023 Sales Growth 37.396%
Fiscal Year-end 12 / 2024 Employees 18,233
View SEC Filings

CP Valuation

P/E Current 25.546
P/E Ratio (with extraordinary items) N/A
P/E Ratio (without extraordinary items) 25.515
Price to Sales Ratio 7.981
Price to Book Ratio 2.355
Price to Cash Flow Ratio 24.22
Enterprise Value to EBITDA 20.428
Enterprise Value to Sales 9.88
Total Debt to Enterprise Value 0.188

CP Efficiency

Revenue/Employee 510,182.469
Income Per Employee 159,576.787
Receivables Turnover 6.50
Total Asset Turnover 0.161

CP Liquidity

Current Ratio 0.526
Quick Ratio 0.456
Cash Ratio 0.081

CP Profitability

Gross Margin 38.216
Operating Margin 36.01
Pretax Margin -24.317
Net Margin 31.278
Return on Assets 5.043
Return on Equity 9.672
Return on Total Capital 5.964
Return on Invested Capital 6.571

CP Capital Structure

Total Debt to Total Equity 55.042
Total Debt to Total Capital 35.501
Total Debt to Total Assets 28.409
Long-Term Debt to Equity 47.221
Long-Term Debt to Total Capital 30.457
  • Income Statement
  • Balance Sheet
  • Cash Flow Statement

Annual Financials for Canadian Pacific Kansas City Ltd. - CP

Collapse All in section
All values USD millions. 2020 2021 2022 2023 5-year trend
Sales/Revenue
5.75B 6.38B 6.77B 9.30B
Sales Growth
-2.11% +10.94% +6.17% +37.40%
Cost of Goods Sold (COGS) incl D&A
3.18B 3.65B 4.07B 5.75B
COGS excluding D&A
- - - -
-
Depreciation & Amortization Expense
588.23M 654.84M 661.36M 1.15B
Depreciation
586.00M 652.45M 659.06M 1.15B
Amortization of Intangibles
2.24M 2.39M 2.30M 2.22M
COGS Growth
-7.27% +14.68% +11.48% +41.30%
Gross Income
2.57B 2.73B 2.70B 3.55B
Gross Income Growth
+5.12% +6.30% -0.94% +31.51%
Gross Profit Margin
+44.66% +42.79% +39.93% +38.22%
2020 2021 2022 2023 5-year trend
SG&A Expense
105.87M 96.51M 107.54M 205.23M
Research & Development
- - - -
-
Other SG&A
105.87M 96.51M 107.54M 205.23M
SGA Growth
+2.54% -8.84% +11.43% +90.85%
Other Operating Expense
- - - -
-
Unusual Expense
6.71M (189.04M) 56.84M 111.14M
EBIT after Unusual Expense
2.45B 2.82B 2.54B 3.24B
Non Operating Income/Expense
270.63M 392.43M 321.08M (4.93B)
Non-Operating Interest Income
- - 2.98M 4.79M
-
Equity in Earnings of Affiliates
- - - 178.56M
-
Interest Expense
337.73M 348.56M 500.82M 571.24M
Interest Expense Growth
+0.70% +3.21% +43.68% +14.06%
Gross Interest Expense
349.66M 358.93M 500.82M 571.24M
Interest Capitalized
- - 11.93M 10.37M
-
Pretax Income
2.39B 2.87B 2.36B (2.26B)
Pretax Income Growth
+0.69% +20.02% -17.66% -195.89%
Pretax Margin
+41.53% +44.93% +34.84% -24.32%
Income Tax
565.12M 612.57M 482.39M (5.17B)
Income Tax - Current - Domestic
307.16M 322.24M 255.79M 279.32M
Income Tax - Current - Foreign
93.19M 97.31M 122.13M 394.17M
Income Tax - Deferred - Domestic
172.22M (142.77M) 135.96M 176.34M
Income Tax - Deferred - Foreign
(7.46M) 335.80M (31.49M) (6.02B)
Income Tax Credits
- - - -
-
Equity in Earnings of Affiliates
- - - 178.56M
-
Other After Tax Income (Expense)
- - - -
-
Consolidated Net Income
1.82B 2.27B 2.70B 2.91B
Minority Interest Expense
- - - (2.96M)
-
Net Income
1.82B 2.27B 2.70B 2.91B
Net Income Growth
-0.91% +24.84% +18.76% +7.70%
Net Margin Growth
+31.70% +35.67% +39.90% +31.28%
Extraordinaries & Discontinued Operations
- - - -
-
Discontinued Operations
- - - -
-
Net Income After Extraordinaries
1.82B 2.27B 2.70B 2.91B
Preferred Dividends
- - - -
-
Net Income Available to Common
1.82B 2.27B 2.70B 2.91B
EPS (Basic)
2.6895 3.3468 2.9049 3.1242
EPS (Basic) Growth
+1.50% +24.44% -13.20% +7.55%
Basic Shares Outstanding
677.50M 679.70M 930.00M 931.30M
EPS (Diluted)
2.6796 3.3316 2.8958 3.1162
EPS (Diluted) Growth
+1.49% +24.33% -13.08% +7.61%
Diluted Shares Outstanding
680.00M 682.80M 932.90M 933.70M
EBITDA
3.05B 3.29B 3.26B 4.50B
EBITDA Growth
+6.06% +7.80% -0.92% +38.13%
EBITDA Margin
+53.05% +51.54% +48.11% +48.36%

Snapshot

Average Recommendation OVERWEIGHT Average Target Price 126.809
Number of Ratings 32 Current Quarters Estimate 1.26
FY Report Date 12 / 2024 Current Year's Estimate 4.23
Last Quarter’s Earnings 0.99 Median PE on CY Estimate N/A
Year Ago Earnings 3.84 Next Fiscal Year Estimate 4.975
Median PE on Next FY Estimate N/A

Earnings Per Share

This Quarter Next Quarter This Fiscal Next Fiscal
# of Estimates 26 19 28 28
Mean Estimate 1.26 1.09 4.23 4.98
High Estimates 1.29 1.16 4.31 5.32
Low Estimate 1.22 1.04 4.19 4.82
Coefficient of Variance 1.61 3.25 0.60 2.07

Analysts Recommendations

Current 1 Month Ago 3 Months Ago
BUY 20 20 19
OVERWEIGHT 2 2 2
HOLD 10 10 11
UNDERWEIGHT 0 0 0
SELL 0 0 0
MEAN Overweight Overweight Overweight

Canadian Pacific Kansas City Ltd. in the News

Markets

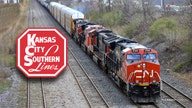
Kansas City Southern expected to terminate Canadian Pacific deal

Kansas City Southern is expected to ditch its merger agreement with Canadian Pacific Railway Ltd. in favor of a competing proposal from Canadian National Railway Co. according to people familiar with the matter, a dramatic turn with big implications for the shape of the U.S. rail industry.