About the campbell's co. - CPB
CPB At a Glance
| Phone | 1-856-342-4800 | Revenue | 10.25B | |
| Industry | Food: Specialty/Candy | Net Income | 602.00M | |
| Sector | Consumer Non-Durables | 2025 Sales Growth | 6.403% | |
| Fiscal Year-end | 07 / 2026 | Employees | 13,700 | |
| View SEC Filings |
CPB Valuation
| P/E Current | 10.937 |
| P/E Ratio (with extraordinary items) | N/A |
| P/E Ratio (without extraordinary items) | 16.111 |
| Price to Sales Ratio | 0.946 |
| Price to Book Ratio | 2.469 |
| Price to Cash Flow Ratio | 8.58 |
| Enterprise Value to EBITDA | 9.11 |
| Enterprise Value to Sales | 1.637 |
| Total Debt to Enterprise Value | 0.43 |
CPB Efficiency
| Revenue/Employee | 748,394.161 |
| Income Per Employee | 43,941.606 |
| Receivables Turnover | 17.587 |
| Total Asset Turnover | 0.681 |
CPB Liquidity
| Current Ratio | 0.768 |
| Quick Ratio | 0.278 |
| Cash Ratio | 0.045 |
CPB Profitability
| Gross Margin | 29.913 |
| Operating Margin | 13.733 |
| Pretax Margin | 7.764 |
| Net Margin | 5.871 |
| Return on Assets | 3.996 |
| Return on Equity | 15.644 |
| Return on Total Capital | 5.417 |
| Return on Invested Capital | 5.996 |
CPB Capital Structure
| Total Debt to Total Equity | 184.828 |
| Total Debt to Total Capital | 64.891 |
| Total Debt to Total Assets | 48.416 |
| Long-Term Debt to Equity | 162.84 |
| Long-Term Debt to Total Capital | 57.171 |
The Campbell'S Co. in the News

Campbell's Soup executive allegedly calls company products 's--- for poor people' in secret recording
Campbell's Soup executive caught on secret recording calling products "s--- for poor people" and making racist comments about coworkers in explosive lawsuit.

Major food brands turn to smaller package sizes to win over today's consumers
Companies like Mondelēz and Campbell's are innovating with smaller package sizes to maintain brand relevance as consumers become more cautious with spending and focused on health.

More Americans turn to home cooking as economic concerns weigh
Amid economic uncertainty, the Campbell's CEO notes a shift toward home-cooked meals and budget-friendly ingredients, with food inflation continuing to challenge consumers.

Campbell's CEO to retire, join Washington Commanders' front office
Campbell’s CEO Mark Clouse will retire from the packaged food company and join the Washington Commanders' front office early next year. He will head the team's business operations.

Campbell Soup to make historic name change
Campbell Soup plans to change its name after 155 years in business as it transitions its portfolio to include more products, the company said on Tuesday.
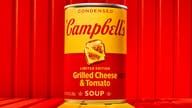
Campbell's releases new tomato soup flavor inspired by beloved comfort dish: 'Classic pairing'
Campbell's is debuting its limited-time Grilled Cheese and Tomato Soup product, claiming that the soup product's taste can be altered by adding either milk or water.

Giants' Kayvon Thibodeaux helps Campbell's Chunky Sacks Hunger at food donation event in New Jersey
The Giants' Kayvon Thibodeaux helped Campbell's Chunky pack donated meals for the needy as part of the Chunky Sacks Hunger initiative, which aims to donate 2 million meals.

Goldfish launches 'Mega Bites' crackers for adults: 'Appeal to all age groups'
“The Snack that Smiles Back” just got a little bigger for its consumer base.
These food items are getting more costly in 2022
Everything from coffee to mustard will be getting more expensive next year as many food manufacturers say they intend to raise prices for a range of products from macaroni-and-cheese to snacks.

High steel prices have manufacturers scrounging for supplies
Manufacturers are facing the highest steel and aluminum prices in years, another hurdle for U.S. companies already struggling to make enough cars, cans, and other products.