About salesforce inc. - CRM
CRM At a Glance
| Phone | 1-415-901-7000 | Revenue | 41.53B | |
| Industry | Packaged Software | Net Income | 7.46B | |
| Sector | Technology Services | 2026 Sales Growth | 9.579% | |
| Fiscal Year-end | 01 / 2027 | Employees | 83,334 | |
| View SEC Filings |
CRM Valuation
| P/E Current | 17.377 |
| P/E Ratio (with extraordinary items) | N/A |
| P/E Ratio (without extraordinary items) | 27.216 |
| Price to Sales Ratio | 4.887 |
| Price to Book Ratio | 3.335 |
| Price to Cash Flow Ratio | 13.53 |
| Enterprise Value to EBITDA | 16.823 |
| Enterprise Value to Sales | 5.084 |
| Total Debt to Enterprise Value | 0.084 |
CRM Efficiency
| Revenue/Employee | 498,296.014 |
| Income Per Employee | 89,483.284 |
| Receivables Turnover | 2.896 |
| Total Asset Turnover | 0.376 |
CRM Liquidity
| Current Ratio | 0.704 |
| Quick Ratio | 0.704 |
| Cash Ratio | 0.258 |
CRM Profitability
| Gross Margin | 75.28 |
| Operating Margin | 21.474 |
| Pretax Margin | 22.926 |
| Net Margin | 17.958 |
| Return on Assets | 6.758 |
| Return on Equity | 12.396 |
| Return on Total Capital | 9.703 |
| Return on Invested Capital | 10.331 |
CRM Capital Structure
| Total Debt to Total Equity | 29.947 |
| Total Debt to Total Capital | 23.045 |
| Total Debt to Total Assets | 15.341 |
| Long-Term Debt to Equity | 21.792 |
| Long-Term Debt to Total Capital | 16.77 |
Salesforce Inc. in the News

AI leaders argue software will adapt — not die — but valuations are stretched
Major tech companies lost $1 trillion in a market sell-off this week, sending chills across tech industry. However, I unicorn founders believe valuations will normalize.

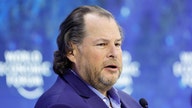
Salesforce cuts 4,000 jobs due to AI, CEO says
Salesforce CEO Marc Benioff said AI automation helped the software company cut its customer support headcount from 9,000 to 5,000 human workers.

Salesforce boss reveals the stunning amount of work now handled by AI
Salesforce CEO Marc Benioff revealed the software company uses artificial intelligence technology to perform quite a bit of its work, telling Bloomberg it is "doing 30% to 50%."
Salesforce to acquire Informatica for $8B to boost AI capabilities
Salesforce's $8 billion acquisition of Informatica aims to strengthen its position in the enterprise data market by integrating advanced data management and AI solutions.

Business leaders react to California wildfires: 'Heartbreaking'
Several business leaders have reacted on social media to the wildfires raging in Southern California, including Apple's Tim Cook, Salesforce's Marc Benioff and Disney's Bob Iger.

Disney leak included personal information for some cruise line workers: report
Details about what was contained in a major Disney data leak from earlier this summer have been revealed by The Wall Street Journal, and include guests and staff information.

Want to work in Big Tech? Here are companies with the fastest (and slowest) hiring processes
Landing a job in Big Tech can be a rigorous process. A new study ranked America's tech giants according to how long it takes between a candidate's first interview and receiving an offer.

Saks owner to buy Neiman Marcus — with help from Amazon
The parent of Saks Fifth Avenue sealed a $2.65 billion deal to buy rival Neiman Marcus, according to people familiar — all with a little help from Amazon.
An auction to have lunch with Salesforce CEO Marc Benioff to launch in early May
A lunch with Salesforce CEO Marc Benioff will hit the virtual auction block in early May as a San Francisco-based nonprofit looks to raise funds.
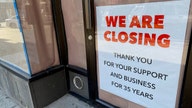
One-third of small business owners worried their company won't survive 2024
One in three small business owners in the U.S. are concerned their businesses will not make it through the end of 2024, with top concerns being the economy and declining sales.