About mercedes-benz group ag - MBGAF
MBGAF At a Glance
| Phone | 49-711-17-0 | Revenue | 149.21B | |
| Industry | Motor Vehicles | Net Income | 5.80B | |
| Sector | Consumer Durables | Employees | 164,120 | |
| Fiscal Year-end | 12 / 2026 | |||
| View SEC Filings |
MBGAF Valuation
| P/E Current | 9.692 |
| P/E Ratio (with extraordinary items) | N/A |
| P/E Ratio (without extraordinary items) | 11.702 |
| Price to Sales Ratio | 0.455 |
| Price to Book Ratio | 0.617 |
| Price to Cash Flow Ratio | 3.34 |
| Enterprise Value to EBITDA | 6.72 |
| Enterprise Value to Sales | 1.099 |
| Total Debt to Enterprise Value | 0.716 |
MBGAF Efficiency
| Revenue/Employee | 909,175.025 |
| Income Per Employee | 35,352.299 |
| Receivables Turnover | 2.887 |
| Total Asset Turnover | 0.52 |
MBGAF Liquidity
| Current Ratio | 1.385 |
| Quick Ratio | 1.06 |
| Cash Ratio | 0.26 |
MBGAF Profitability
| Gross Margin | 17.18 |
| Operating Margin | 4.915 |
| Pretax Margin | 3.907 |
| Net Margin | 3.888 |
| Return on Assets | 2.02 |
| Return on Equity | 5.648 |
| Return on Total Capital | 2.556 |
| Return on Invested Capital | 3.27 |
MBGAF Capital Structure
| Total Debt to Total Equity | 107.237 |
| Total Debt to Total Capital | 51.746 |
| Total Debt to Total Assets | 39.147 |
| Long-Term Debt to Equity | 66.923 |
| Long-Term Debt to Total Capital | 32.293 |
Mercedes-Benz Group Ag in the News

Mercedes-Benz recalls over 24,000 vehicles due to drive shaft defect that could cause sudden failure
Mercedes-Benz is recalling more than 24,000 vehicles after federal safety officials flagged a defect that could cause a critical drive shaft component to break without warning.

Mercedes-Benz workers at Alabama plant slated for union vote in May
Workers at the Mercedes-Benz factory in Vance, Alabama, are scheduled to vote next month on whether to the join the United Auto Workers amid the union's organization push.
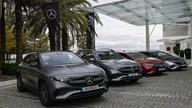
Mercedes-Benz delays EV goals because of weak demand, will continue to build gas-powered cars
German automaker Mercedes-Benz said it will delay plans to have half of all sales be electric vehicles or hybrids until 2030 because of weak demand.
Ford, GM, Mercedes come clean on EV demand weakness
Ford, General Motors and Mercedes-Benz all responded to concerns over waning demand for electric vehicles this week, as automakers navigate the EV push.

GOP reps urge Ford, Tesla and other automakers to keep 'life-saving' AM radio in new models
Rep. Bob Latta, R-Ohio, and Rep. Greg Pence, R-Ind., press leading car manufacturers on the decision to remove AM radio from new models in a Fox News Digital exclusive.
Mercedes to offer 'super computer-like performance' in cars with Google partnership
Automaker Mercedes-Benz and Google announced a partnership on Wednesday that will allow drivers to access navigation, automatic rerouting and other features in vehicles.
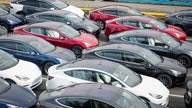
Tesla was the USA's best selling luxury car brand in 2022, beating BMW and Mercedes-Benz
Tesla outsold BMW, Mercedes-Benz and Lexus to become the best-selling luxury car brand in the United States in 2022 with its four-model lineup.
Mercedes-Benz releasing 'Acceleration Increase' subscription fee for electric vehicles
German automaker Mercedes-Benz is releasing a new "Acceleration Increase" feature that costs $1,200 a year and allows their cars to go from 0 to 60 mph one second faster.