About nissan motor co. ltd. - NSANF
Nissan Motor Co., Ltd. engages in the manufacture and sale of automotive products and marine equipment. It operates through the Automobile and Sales Financing segments. The Automobile Business segment manufactures and sells vehicles, forklift, marine equipment, and related parts. The Sales Financing Business segment handles sales finance and leasing business to support the sales activity of automobile business. The company was founded on December 26, 1933 and is headquartered in Yokohama, Japan.
NSANF At a Glance
Nissan Motor Co., Ltd.
2 Takaramachi
Yokohama, Kanagawa 220-8623
| Phone | 81-45-523-5523 | Revenue | 79.68B | |
| Industry | Motor Vehicles | Net Income | -3,537,644,330.85 | |
| Sector | Consumer Durables | Employees | 120,079 | |
| Fiscal Year-end | 03 / 2027 | |||
| View SEC Filings |
NSANF Valuation
| P/E Current | N/A |
| P/E Ratio (with extraordinary items) | N/A |
| P/E Ratio (without extraordinary items) | N/A |
| Price to Sales Ratio | 0.092 |
| Price to Book Ratio | 0.243 |
| Price to Cash Flow Ratio | 1.39 |
| Enterprise Value to EBITDA | 11.391 |
| Enterprise Value to Sales | 0.652 |
| Total Debt to Enterprise Value | 1.08 |
NSANF Efficiency
| Revenue/Employee | 663,604.197 |
| Income Per Employee | -29,460.974 |
| Receivables Turnover | 1.612 |
| Total Asset Turnover | 0.633 |
NSANF Liquidity
| Current Ratio | 1.56 |
| Quick Ratio | 1.36 |
| Cash Ratio | 0.279 |
NSANF Profitability
| Gross Margin | 12.381 |
| Operating Margin | 0.483 |
| Pretax Margin | -3.667 |
| Net Margin | -4.44 |
| Return on Assets | -2.81 |
| Return on Equity | -11.173 |
| Return on Total Capital | -4.102 |
| Return on Invested Capital | -5.595 |
NSANF Capital Structure
| Total Debt to Total Equity | 185.875 |
| Total Debt to Total Capital | 65.02 |
| Total Debt to Total Assets | 45.023 |
| Long-Term Debt to Equity | 110.833 |
| Long-Term Debt to Total Capital | 38.77 |
Nissan Motor Co. Ltd. in the News
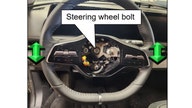
Nissan is recalling 1,063 electric cars because the steering wheel might fall off
Nissan is recalling 1,063 Ariya electric SUVs to check if their steering wheels are installed correctly after an issue was discovered on several that had been repaired.
Nissan pulls out of Russia, sells all assets to state for 1 Euro
Nissan sold all of its assets in Russia to the state for 1 Euro on Tuesday. The company is only the latest to flee amid increasingly severe sanctions in Russia.
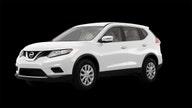
793,000 Nissan Rogue SUVs recalled for fire risk
Nissan is recalling 793,000 Rogue SUVs in the U.S. and Canada because water can corrode a wiring connector and cause a fire.
Biden spending plan includes $100B for electric vehicle rebates
The Department of Transportation has sent a letter to congressional staff that said President Biden's proposed infrastructure plan includes $100 billion in new credits for electric vehicle purchases.