About procter & gamble co. - PG
PG At a Glance
| Phone | 1-513-983-1100 | Revenue | 84.28B | |
| Industry | Household/Personal Care | Net Income | 15.97B | |
| Sector | Consumer Non-Durables | 2025 Sales Growth | 0.292% | |
| Fiscal Year-end | 06 / 2026 | Employees | 109,000 | |
| View SEC Filings |
PG Valuation
| P/E Current | 21.719 |
| P/E Ratio (with extraordinary items) | N/A |
| P/E Ratio (without extraordinary items) | 24.48 |
| Price to Sales Ratio | 4.639 |
| Price to Book Ratio | 7.282 |
| Price to Cash Flow Ratio | 21.95 |
| Enterprise Value to EBITDA | 17.747 |
| Enterprise Value to Sales | 4.959 |
| Total Debt to Enterprise Value | 0.085 |
PG Efficiency
| Revenue/Employee | 773,247.706 |
| Income Per Employee | 146,550.459 |
| Receivables Turnover | 13.627 |
| Total Asset Turnover | 0.681 |
PG Liquidity
| Current Ratio | 0.704 |
| Quick Ratio | 0.495 |
| Cash Ratio | 0.265 |
PG Profitability
| Gross Margin | 51.338 |
| Operating Margin | 24.567 |
| Pretax Margin | 23.927 |
| Net Margin | 18.953 |
| Return on Assets | 12.903 |
| Return on Equity | 31.23 |
| Return on Total Capital | 18.261 |
| Return on Invested Capital | 20.755 |
PG Capital Structure
| Total Debt to Total Equity | 68.184 |
| Total Debt to Total Capital | 40.541 |
| Total Debt to Total Assets | 28.319 |
| Long-Term Debt to Equity | 50.153 |
| Long-Term Debt to Total Capital | 29.375 |
Procter & Gamble Co. in the News
Parent company of Charmin and Tide brands to raise prices on other products due to tariff pressure
P&G plans single-digit price hikes on about a quarter of its U.S. products as it looks to offset about $1 billion in cost increases stemming from higher tariffs.
Procter & Gamble slashing up to 7,000 jobs amid restructuring effort
Procter & Gamble is slashing up to 15% of its non-manufacturing positions over the next two years as part of a broader restructuring effort. The cuts will affect up to 7,000 roles.

US corporate bond spreads tighten to four-week low as trade war calms
Analysts attributed narrowing spreads largely to an apparent calm in global trade tensions last week. They also pointed to data showing a resilient economy and market technicals.
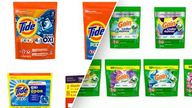
8.4M Tide, Gain and other laundry pods recalled over unsafe packaging
Millions of packages of laundry pods have been recalled because they could split open and pose a risk of harm to children and other vulnerable populations.

Meet Disney's newly elected board
Disney CEO Bob Iger will be working closely with his newly elected board, which boasts a handful of current and former Fortune 500 executives and some niche corporate insiders.

Toilet paper mega-brand introduces ‘cutting edge’ design: Find out what it is
A well-known toilet paper brand has announced a new design in its popular household item. Charmin said the new "smooth tear" toilet paper will be a better experience for consumers.

Tampax faces boycott calls for 'sexualizing women' in controversial tweet
Tampax is being accused of “sexualizing women" after posting a controversial tweet that has now gone viral, leading for calls to boycott the company.

PG&E releases new plan on 2022 wildfire safety
Pacific Gas and Electric Corp. (PG&E) filed its 2022 Wildfire Mitigation Plan with state regulators on Friday and announced plans to "significantly accelerate the undergrounding of powerlines in high fire-risk areas."

Beijing Olympics sponsor Procter & Gamble silent on Uyghur genocide after calling out US 'systemic racism'
Procter & Gamble (P&G), an official sponsor of the 2022 Winter Olympics in China, is staying mum on the country's genocide of Uyghur Muslims despite being vocal on human rights issues in the U.S.

GOP congressman says NBC refused to air advertisement slamming 'Genocide Games' sponsors
NBC is allegedly refusing to air a Republican congressman's advertisement that criticizes several United States corporations for sponsoring the 2022 Olympic Games in Beijing.