About koninklijke philips nv - PHG
Koninklijke Philips NV is a technology company, which engages in the healthcare, lighting, and consumer well-being markets. It operates through the following segments: Diagnosis and Treatment; Connected Care; Personal Health; and Other. The Diagnosis and Treatment segment consists of systems, smart devices, software, and services, powered by AI-enabled solutions that support precision diagnoses and minimally invasive treatment in therapeutic areas such as cardiology, peripheral vascular, neurology, surgery, and oncology. The Connected Care segment focuses on Hospital Patient Monitoring, Sleep and Respiratory Care, and Enterprise Informatics. The Personal Health segment represents Oral Healthcare business unit, Personal Care business unit, and Mother and Child Care business unit. The Other segment is involved on the Innovation and Strategy, IP Royalties, Central costs, and other small items. The company was founded by Anton Frederik Philips and Gerard Leonard Frederik Philips in 1891 and is headquartered in Amsterdam, the Netherlands.
PHG At a Glance
Koninklijke Philips NV
Breitner Center
Amsterdam, Noord-Holland 1096 BC
| Phone | 31-20-597-77-77 | Revenue | 20.13B | |
| Industry | Medical/Nursing Services | Net Income | 1.01B | |
| Sector | Health Services | 2025 Sales Growth | 3.252% | |
| Fiscal Year-end | 12 / 2026 | Employees | 66,401 | |
| View SEC Filings |
PHG Valuation
| P/E Current | 23.076 |
| P/E Ratio (with extraordinary items) | N/A |
| P/E Ratio (without extraordinary items) | 25.337 |
| Price to Sales Ratio | 1.295 |
| Price to Book Ratio | 2.002 |
| Price to Cash Flow Ratio | 19.71 |
| Enterprise Value to EBITDA | 10.70 |
| Enterprise Value to Sales | 1.606 |
| Total Debt to Enterprise Value | 0.294 |
PHG Efficiency
| Revenue/Employee | 303,113.796 |
| Income Per Employee | 15,228.774 |
| Receivables Turnover | 4.35 |
| Total Asset Turnover | 0.646 |
PHG Liquidity
| Current Ratio | 1.323 |
| Quick Ratio | 0.94 |
| Cash Ratio | 0.372 |
PHG Profitability
| Gross Margin | 41.802 |
| Operating Margin | 9.207 |
| Pretax Margin | 6.678 |
| Net Margin | 5.024 |
| Return on Assets | 3.259 |
| Return on Equity | 8.02 |
| Return on Total Capital | 4.537 |
| Return on Invested Capital | 4.972 |
PHG Capital Structure
| Total Debt to Total Equity | 73.788 |
| Total Debt to Total Capital | 42.459 |
| Total Debt to Total Assets | 29.731 |
| Long-Term Debt to Equity | 63.284 |
| Long-Term Debt to Total Capital | 36.414 |
Koninklijke Philips Nv in the News

Philips to invest over $150M in US manufacturing, research facilities
Healthcare technology company Philips announced that it is investing more than $150 million in U.S. manufacturing and research and development facilities.
Philips pays $1.1B to settle sleep apnea device suits
Philips Respironics announced that it agreed to pay over a billion dollars to settle claims stemming from the 2021 U.S. recall of its sleep therapy devices.
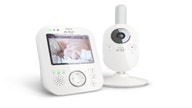
Philips recalls nearly 13K baby monitors for risk related to overheating batteries
Philips put over 12,800 Philips Avent digital video baby monitors under recall in response to a possible burn hazard. Parents should avoid further use of the affected devices, the CPSC said.

Philips recalls sleep apnea machines, ventilators over possible cancer risk
Philips has issued a recall for select sleep apnea machines and ventilators over concerns that a foam component may disintegrate and be inhaled by the user possibly causing health issues including toxic and carcinogenic effects.