About ferrari nv - RACE
RACE At a Glance
| Phone | 39-536-949-111 | Revenue | 8.06B | |
| Industry | Motor Vehicles | Net Income | 1.80B | |
| Sector | Consumer Durables | 2025 Sales Growth | 11.665% | |
| Fiscal Year-end | 12 / 2026 | Employees | 5,718 | |
| View SEC Filings |
RACE Valuation
| P/E Current | 34.757 |
| P/E Ratio (with extraordinary items) | N/A |
| P/E Ratio (without extraordinary items) | 36.994 |
| Price to Sales Ratio | 8.276 |
| Price to Book Ratio | 14.461 |
| Price to Cash Flow Ratio | 25.17 |
| Enterprise Value to EBITDA | 21.673 |
| Enterprise Value to Sales | 8.472 |
| Total Debt to Enterprise Value | 0.05 |
RACE Efficiency
| Revenue/Employee | 1,410,380.588 |
| Income Per Employee | 315,188.453 |
| Receivables Turnover | 9.808 |
| Total Asset Turnover | 0.753 |
RACE Liquidity
| Current Ratio | 1.694 |
| Quick Ratio | 1.156 |
| Cash Ratio | 0.746 |
RACE Profitability
| Gross Margin | 52.456 |
| Operating Margin | 29.828 |
| Pretax Margin | 28.703 |
| Net Margin | 22.348 |
| Return on Assets | 16.83 |
| Return on Equity | 43.702 |
| Return on Total Capital | 22.596 |
| Return on Invested Capital | 28.62 |
RACE Capital Structure
| Total Debt to Total Equity | 73.824 |
| Total Debt to Total Capital | 42.471 |
| Total Debt to Total Assets | 29.245 |
| Long-Term Debt to Equity | 49.193 |
| Long-Term Debt to Total Capital | 28.30 |
Ferrari Nv in the News
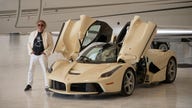
Sammy Hagar explains why fans have to wait even longer for his rare Ferrari supercar auction
Sammy Hagar's Ferrari supercar will now be auctioned off this fall rather than next week after an inspection revealed it needed a battery replacement.
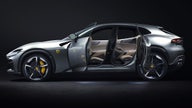
Ferrari's $400K SUV is sold out until 2026
Ferrari's first-quarter profits were up 27% thanks in part to the new Purosangue SUV, its first four-door model, which is sold out until 2026.
$375,000 Ferrari Purosangue SUV sold out for two years
The V12-powered Ferrari Purosangue is sold out for at least two years, according to the company's head of marketing. The $375,000 utility vehicle can go over 190 mph.
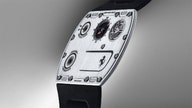
The world's thinnest watch is a $1.9 million Ferrari
The Richard Mille UP-91 Ferrari is the world's thinnest mechanical watch at just 1.75 mm in thickness. The titanium timepiece costs $1.9 million.

Ferrari isn't killing its gas-powered engines anytime soon
Ferrari will add hybrid and all-electric models to its lineup in the coming years, but doesn't plan to entirely eliminate internal combustion engines from its lineup.
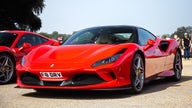
Ferrari's 'last' V8 supercar is apparently sold out
Ferrari has stopped taking orders for the F8 Tributo coupe and F8 Spider convertible.
Ferrari stripping Russian sponsor Kaspersky Lab from its Formula One cars
Ferrari's Formula One team will not feature the logos of its sponsor Kaspersky Labs until further notice as the automaker assesses its relationship with the software security firm. Several governments are concerned that the company's products could be hacked by Russian agents.
Ferrari suspends Russia sales, donates $1 million to Ukraine aid
Ferrari said it has stopped building cars for Russia until further notice and will donate 1 million euros to Ukrainian relief.