red robin gourmet burgers inc. - RRGB

RRGB

Close Chg Chg %
4.97 -0.05 -1.01%

Closed Market

4.92

-0.05 (1.01%)

Volume: 237.86K

Last Updated:

Nov 21, 2024, 4:00 PM EDT

Company Overview: red robin gourmet burgers inc. - RRGB

RRGB Key Data

Open

$5.00

Day Range

4.84 - 5.10

52 Week Range

2.97 - 12.80

Market Cap

$78.41M

Shares Outstanding

15.78M

Public Float

14.46M

Beta

2.72

Rev. Per Employee

N/A

P/E Ratio

N/A

EPS

-$3.28

Yield

0.00%

Dividend

N/A

EX-DIVIDEND DATE

SHORT INTEREST

N/A

AVERAGE VOLUME

342.94K


RRGB Performance

1 Week
 
-5.75%
 
1 Month
 
-15.90%
 
3 Months
 
13.36%
 
1 Year
 
-48.21%
 
5 Years
 
-81.13%
 

RRGB Analyst Ratings

  • Sell
  • Under
  • Hold
  • Over
  • Buy
Number of Ratings 5
Full Ratings ➔

About red robin gourmet burgers inc. - RRGB

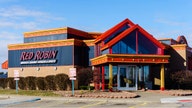
Red Robin Gourmet Burgers, Inc. develops, operates, and franchises full-service restaurants North America. It serves a variety of salads, soups, appetizers, other entrees, desserts, signature alcoholic and non-alcoholic beverages. The company was founded in September 1969 and is headquartered in Englewood, CO.

RRGB At a Glance

Red Robin Gourmet Burgers, Inc.
10000 East Geddes Avenue
Englewood, Colorado 80112
Phone 1-303-846-6000 Revenue 1.30B
Industry Restaurants Net Income -21,228,000.00
Sector Consumer Services 2023 Sales Growth 2.876%
Fiscal Year-end 12 / 2024 Employees 22,516
View SEC Filings

RRGB Valuation

P/E Current N/A
P/E Ratio (with extraordinary items) N/A
P/E Ratio (without extraordinary items) N/A
Price to Sales Ratio 0.152
Price to Book Ratio N/A
Price to Cash Flow Ratio N/A
Enterprise Value to EBITDA 11.426
Enterprise Value to Sales 0.602
Total Debt to Enterprise Value 0.789

RRGB Efficiency

Revenue/Employee 57,872.002
Income Per Employee -942.796
Receivables Turnover 60.349
Total Asset Turnover 1.441

RRGB Liquidity

Current Ratio 0.493
Quick Ratio 0.349
Cash Ratio 0.169

RRGB Profitability

Gross Margin 9.715
Operating Margin 0.189
Pretax Margin -1.605
Net Margin -1.629
Return on Assets -2.347
Return on Equity N/A
Return on Total Capital -3.549
Return on Invested Capital -3.647

RRGB Capital Structure

Total Debt to Total Equity N/A
Total Debt to Total Capital 103.418
Total Debt to Total Assets 72.428
Long-Term Debt to Equity N/A
Long-Term Debt to Total Capital 95.934
  • Income Statement
  • Balance Sheet
  • Cash Flow Statement

Annual Financials for Red Robin Gourmet Burgers Inc. - RRGB

Collapse All in section
All values USD millions. 2020 2021 2022 2023 5-year trend
Sales/Revenue
868.72M 1.16B 1.27B 1.30B
Sales Growth
-33.94% +33.77% +9.00% +2.88%
Cost of Goods Sold (COGS) incl D&A
882.86M 1.06B 1.15B 1.18B
COGS excluding D&A
- - - -
-
Depreciation & Amortization Expense
87.56M 83.44M 76.25M 66.19M
Depreciation
83.16M 80.54M 73.75M 63.79M
Amortization of Intangibles
4.40M 2.90M 2.50M 2.40M
COGS Growth
-23.25% +19.90% +8.35% +2.58%
Gross Income
(14.14M) 103.53M 119.73M 126.60M
Gross Income Growth
-108.58% +831.92% +15.64% +5.74%
Gross Profit Margin
-1.63% +8.91% +9.45% +9.72%
2020 2021 2022 2023 5-year trend
SG&A Expense
106.82M 122.74M 136.61M 124.13M
Research & Development
- - - -
-
Other SG&A
106.82M 122.74M 136.61M 124.13M
SGA Growth
-31.51% +14.90% +11.30% -9.14%
Other Operating Expense
- - - -
-
Unusual Expense
153.88M 16.07M 48.16M 26.88M
EBIT after Unusual Expense
(274.85M) (35.29M) (65.05M) (24.41M)
Non Operating Income/Expense
1.46M (691.00K) 8.64M 30.06M
Non-Operating Interest Income
- - - -
-
Equity in Earnings of Affiliates
- - - -
-
Interest Expense
10.16M 14.18M 20.64M 26.56M
Interest Expense Growth
-0.15% +39.49% +45.62% +28.66%
Gross Interest Expense
10.16M 14.18M 20.64M 26.56M
Interest Capitalized
- - - -
-
Pretax Income
(283.55M) (50.15M) (77.05M) (20.92M)
Pretax Income Growth
-1,175.14% +82.31% -53.63% +72.85%
Pretax Margin
-32.64% -4.32% -6.08% -1.61%
Income Tax
(7.48M) (152.00K) 747.00K 310.00K
Income Tax - Current - Domestic
(58.99M) (152.00K) 747.00K 310.00K
Income Tax - Current - Foreign
- - - -
-
Income Tax - Deferred - Domestic
- - - 52.44M
-
Income Tax - Deferred - Foreign
- - - (937.00K)
-
Income Tax Credits
- - - -
-
Equity in Earnings of Affiliates
- - - -
-
Other After Tax Income (Expense)
- - - -
-
Consolidated Net Income
(276.07M) (50.00M) (77.80M) (21.23M)
Minority Interest Expense
- - - -
-
Net Income
(276.07M) (50.00M) (77.80M) (21.23M)
Net Income Growth
-3,393.21% +81.89% -55.59% +72.71%
Net Margin Growth
-31.78% -4.30% -6.14% -1.63%
Extraordinaries & Discontinued Operations
- - - -
-
Discontinued Operations
- - - -
-
Net Income After Extraordinaries
(276.07M) (50.00M) (77.80M) (21.23M)
Preferred Dividends
- - - -
-
Net Income Available to Common
(276.07M) (50.00M) (77.80M) (21.23M)
EPS (Basic)
-19.2866 -3.193 -4.9116 -1.3406
EPS (Basic) Growth
-3,062.77% +83.44% -53.82% +72.71%
Basic Shares Outstanding
14.31M 15.66M 15.84M 15.84M
EPS (Diluted)
-19.2866 -3.193 -4.9116 -1.3406
EPS (Diluted) Growth
-3,062.77% +83.44% -53.82% +72.71%
Diluted Shares Outstanding
14.31M 15.66M 15.84M 15.84M
EBITDA
(33.41M) 64.22M 59.36M 68.66M
EBITDA Growth
-133.22% +292.23% -7.57% +15.66%
EBITDA Margin
-3.85% +5.53% +4.69% +5.27%

Snapshot

Average Recommendation OVERWEIGHT Average Target Price 10.875
Number of Ratings 5 Current Quarters Estimate -0.502
FY Report Date 12 / 2024 Current Year's Estimate -2.80
Last Quarter’s Earnings -1.13 Median PE on CY Estimate N/A
Year Ago Earnings -1.44 Next Fiscal Year Estimate -1.712
Median PE on Next FY Estimate N/A

Earnings Per Share

This Quarter Next Quarter This Fiscal Next Fiscal
# of Estimates 5 3 5 5
Mean Estimate -0.50 -0.40 -2.80 -1.71
High Estimates -0.33 -0.19 -2.26 -1.63
Low Estimate -0.62 -0.69 -3.02 -1.81
Coefficient of Variance -25.02 -65.80 -11.22 -5.03

Analysts Recommendations

Current 1 Month Ago 3 Months Ago
BUY 3 3 3
OVERWEIGHT 0 0 0
HOLD 2 2 2
UNDERWEIGHT 0 0 0
SELL 0 0 0
MEAN Overweight Overweight Overweight

Insider Actions for Red Robin Gourmet Burgers Inc. - RRGB

Date Name Shares Transaction Value
Nov 8, 2024 Jumana Capital 814,452 Open market or private purchase of non-derivative security Non-derivative transaction at $5.18 per share 4,218,861.36
Nov 8, 2024 Jumana Capital 769,452 Open market or private purchase of non-derivative security Non-derivative transaction at $5.99 per share 4,609,017.48
Nov 8, 2024 JCP Investment Management LLC 542,538 Open market or private purchase of non-derivative security Non-derivative transaction at $5.99 per share 3,249,802.62
Nov 8, 2024 JCP Investment Management LLC 472,675 Open market or private purchase of non-derivative security Non-derivative transaction at $5.99 per share 2,831,323.25
Nov 8, 2024 JCP Investment Management LLC 569,015 Open market or private purchase of non-derivative security Non-derivative transaction at $5.18 per share 2,947,497.70
Nov 8, 2024 JCP Investment Management LLC 491,198 Open market or private purchase of non-derivative security Non-derivative transaction at $5.18 per share 2,544,405.64
Sep 13, 2024 Gerard Johan Hart PRESIDENT AND CEO; Director 616,782 Open market or private purchase of non-derivative security Non-derivative transaction at $3.15 per share 1,942,863.30
May 29, 2024 Nicole Miller Regan Director 23,738 Grant, award or other acq pursuant to Rule 16b-3(d) 0.00
May 29, 2024 Allison A. Page Director 53,147 Grant, award or other acq pursuant to Rule 16b-3(d) 0.00
May 29, 2024 Anddria Clack-Rogers Varnado Director 38,983 Grant, award or other acq pursuant to Rule 16b-3(d) 0.00
May 29, 2024 Anthony S. Ackil Director 47,513 Grant, award or other acq pursuant to Rule 16b-3(d) 0.00
May 29, 2024 Steven K. Lumpkin Director 35,249 Grant, award or other acq pursuant to Rule 16b-3(d) 0.00
May 29, 2024 Thomas G. Conforti Director 49,006 Grant, award or other acq pursuant to Rule 16b-3(d) 0.00
May 29, 2024 David A. Pace Director 71,698 Grant, award or other acq pursuant to Rule 16b-3(d) 0.00
May 13, 2024 Kevin E. Mayer CHIEF MARKETING OFFICER 30,628 Payment of exercise price or tax liability by delivering/withholding secs incident to the receipt/exercise/vesting pursuant to Rule 16b-3 Non-derivative transaction at $7.78 per share 238,285.84
May 13, 2024 Kevin E. Mayer CHIEF MARKETING OFFICER 31,453 Payment of exercise price or tax liability by delivering/withholding secs incident to the receipt/exercise/vesting pursuant to Rule 16b-3 Non-derivative transaction at $7.78 per share 244,704.34
Mar 18, 2024 Meghan Spuler CHIEF PEOPLE OFFICER 20,697 Grant, award or other acq pursuant to Rule 16b-3(d) 0.00
Mar 18, 2024 Robyn Arnell Brenden CHIEF ACCOUNTING OFFICER 9,769 Grant, award or other acq pursuant to Rule 16b-3(d) 0.00
Mar 18, 2024 Sarah A. Mussetter CHIEF LEGAL OFFICER 64,345 Grant, award or other acq pursuant to Rule 16b-3(d) 0.00
Mar 18, 2024 Todd Wilson CHIEF FINANCIAL OFFICER 116,610 Grant, award or other acq pursuant to Rule 16b-3(d) 0.00

Red Robin Gourmet Burgers Inc. in the News

Lifestyle

Former Red Robin employee sues company over racial slurs, metal blade in salad

Zenarra James is seeking $25,000 in back pay, front pay and other damages in her lawsuit against the Red Robin location in Madison Heights, Michigan, and the Ansara Restaurant Group, which owns and operates Red Robin and 2Booli restaurants throughout Michigan and Northwest Ohio. It alleges racial discrimination, a hostile work environment, intentional infliction of emotional distress and direct negligence.