About ryanair holdings plc - RYAAY
RYAAY At a Glance
| Phone | 353-1-844-4440 | Revenue | 18.01B | |
| Industry | Airlines | Net Income | 2.52B | |
| Sector | Transportation | 2026 Sales Growth | 20.281% | |
| Fiscal Year-end | 03 / 2027 | Employees | N/A | |
| View SEC Filings |
RYAAY Valuation
| P/E Current | 11.803 |
| P/E Ratio (with extraordinary items) | N/A |
| P/E Ratio (without extraordinary items) | 12.111 |
| Price to Sales Ratio | 1.708 |
| Price to Book Ratio | N/A |
| Price to Cash Flow Ratio | 7.18 |
| Enterprise Value to EBITDA | 6.386 |
| Enterprise Value to Sales | 1.574 |
| Total Debt to Enterprise Value | 0.061 |
RYAAY Efficiency
| Revenue/Employee | N/A |
| Income Per Employee | N/A |
| Receivables Turnover | 353.672 |
| Total Asset Turnover | 0.865 |
RYAAY Liquidity
| Current Ratio | 0.903 |
| Quick Ratio | 0.903 |
| Cash Ratio | 0.417 |
RYAAY Profitability
| Gross Margin | 20.99 |
| Operating Margin | 15.821 |
| Pretax Margin | 15.59 |
| Net Margin | 13.984 |
| Return on Assets | 12.091 |
| Return on Equity | 26.182 |
| Return on Total Capital | 18.856 |
| Return on Invested Capital | 23.46 |
RYAAY Capital Structure
| Total Debt to Total Equity | 14.765 |
| Total Debt to Total Capital | 12.866 |
| Total Debt to Total Assets | 7.553 |
| Long-Term Debt to Equity | 2.504 |
| Long-Term Debt to Total Capital | 2.182 |
Ryanair Holdings Plc in the News

Ryanair welcomes jail sentence for unruly passenger as airline enforces zero-tolerance misconduct policy
Ryanair says unruly passengers now face jail time as a Welsh man gets 10 months for threatening crew and forcing a pilot to abort a landing attempt.
Airline considering bigger bonuses for staff who spot oversized bags
European budget carrier Ryanair is rewarding employees who identify oversized bags with a bonus, as CEO Michael O'Leary considers bigger bonuses for identifying non-compliant luggage.
Airline may raise fares 10%, cut summer flights due to Boeing delays
Ryanair is warning that Boeing's production issues have resulted in delivery delays that may force it to raise prices and cut routes this summer if it doesn't get aircraft on time.
Ryanair flight diverted after mid-air brawl creates chaos: reports
A mid-air fight on a Ryanair flight from London to the Canary Islands was diverted to Portugal on Friday, after a brawl involving several people created a chaotic situation.
Ryanair denies reports of charging a fee for digital boarding passes
Ryanair has issued a denial after some alleged the Ireland-based budget airline made travelers checking in put down more money to select a seat to obtain a mobile boarding pass.
Protester smashes pie in face of airline's group CEO
Protesters pelted Michael O'Leary, group CEO of Ryanair, with a pair of pies on Thursday. He got one to the face and one the back of the head, according to video of the incident.
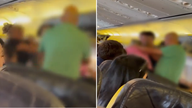
Three Ryanair passengers removed from flight after brawl erupts: video
A video has captured a disruption onboard a Ryanair flight this week before takeoff, resulting in three passengers being removed from the aircraft.
Airbus maintains lead over Boeing in deliveries, lags on orders
Airbus delivered 40 jets in August to bring supplies of its new jets to 384 since the start of the year, remaining broadly on course to meet an annual goal of 600 deliveries that would preserve its crown as no.1 aircraft manufacturer.

Big Boeing customer says it is walking away from new MAX order
Ryanair, Boeing’s biggest customer outside of the U.S., said it is walking away from talks with the U.S. jet maker over a potential new order for the 737 MAX in a dispute over pricing.

Ryanair apologizes after staffers force 12-year-old autistic boy to have COVID-19 test: report
Ryanair, the Dublin-based, low-cost airline, said in a statement Thursday that it regretted learning about the “stress” caused to the family of a 12-year-old autistic boy who was reportedly forced to have a COVID-19 test by its staffers at an airport in Spain.