the j. m. smucker co. - SJM

SJM

Close Chg Chg %
104.80 -0.76 -0.73%

Closed Market

104.04

-0.76 (0.73%)

Volume: 1.10M

Last Updated:

Jul 3, 2025, 12:59 PM EDT

Company Overview: the j. m. smucker co. - SJM

SJM Key Data

Open

$104.77

Day Range

103.43 - 105.00

52 Week Range

93.30 - 125.42

Market Cap

$11.10B

Shares Outstanding

106.68M

Public Float

103.99M

Beta

0.29

Rev. Per Employee

N/A

P/E Ratio

N/A

EPS

-$11.57

Yield

415.07%

Dividend

$1.08

EX-DIVIDEND DATE

May 16, 2025

SHORT INTEREST

N/A

AVERAGE VOLUME

3.00M


SJM Performance

1 Week
 
8.84%
 
1 Month
 
-6.13%
 
3 Months
 
-9.62%
 
1 Year
 
-5.29%
 
5 Years
 
-0.90%
 

SJM Analyst Ratings

  • Sell
  • Under
  • Hold
  • Over
  • Buy
Number of Ratings 19
Full Ratings ➔

About the j. m. smucker co. - SJM

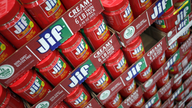
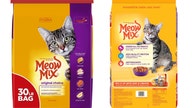
The J. M. Smucker Co. engages in the manufacture and marketing of food and beverage products. It operates through the following segments: U.S. Retail Coffee, U.S. Retail Frozen Handheld and Spreads, U.S. Retail Pet Foods, and Sweet Baked Snacks. The U.S. Retail Coffee segment includes the domestic sales of Folgers, Dunkin’, and Café Bustelo branded coffee. The U.S. Retail Frozen Handheld and Spreads segment focuses on domestic sales of Smucker’s and Jif branded products. The U.S. Retail Pet Foods segment is involved in the domestic sales of Meow Mix, Milk-Bone, Pup-Peroni, and Canine Carry Outs branded products. The Sweet Baked Snacks segment refers to all domestic and foreign sales of Hostess and Voortman branded products in all channels. The company was founded by Jerome Monroe Smucker in 1897 and is headquartered in Orrville, OH.

SJM At a Glance

The J. M. Smucker Co.
One Strawberry Lane
Orrville, Ohio 44667-0280
Phone 1-330-682-3000 Revenue 8.73B
Industry Food: Specialty/Candy Net Income -1,230,700,000.00
Sector Consumer Non-Durables 2025 Sales Growth 6.693%
Fiscal Year-end 04 / 2026 Employees 8,000
View SEC Filings

SJM Valuation

P/E Current N/A
P/E Ratio (with extraordinary items) N/A
P/E Ratio (without extraordinary items) N/A
Price to Sales Ratio 1.418
Price to Book Ratio 2.034
Price to Cash Flow Ratio 10.221
Enterprise Value to EBITDA 9.832
Enterprise Value to Sales 2.305
Total Debt to Enterprise Value 0.388

SJM Efficiency

Revenue/Employee 1,090,762.50
Income Per Employee -153,837.50
Receivables Turnover 14.097
Total Asset Turnover 0.455

SJM Liquidity

Current Ratio 0.809
Quick Ratio 0.353
Cash Ratio 0.026

SJM Profitability

Gross Margin 35.207
Operating Margin 17.685
Pretax Margin -11.996
Net Margin -14.104
Return on Assets -6.419
Return on Equity -17.867
Return on Total Capital -8.858
Return on Invested Capital -8.844

SJM Capital Structure

Total Debt to Total Equity 128.427
Total Debt to Total Capital 56.222
Total Debt to Total Assets 43.899
Long-Term Debt to Equity 117.221
Long-Term Debt to Total Capital 51.317
  • Income Statement
  • Balance Sheet
  • Cash Flow Statement

Annual Financials for The J. M. Smucker Co. - SJM

Collapse All in section
All values USD millions. 2022 2023 2024 2025 5-year trend
Sales/Revenue
8.00B 8.53B 8.18B 8.73B
Sales Growth
-0.05% +6.63% -4.11% +6.69%
Cost of Goods Sold (COGS) incl D&A
5.58B 5.93B 5.28B 5.65B
COGS excluding D&A
- - - -
-
Depreciation & Amortization Expense
459.10M 431.00M 430.80M 502.50M
Depreciation
235.50M 224.10M 239.70M 283.20M
Amortization of Intangibles
223.60M 206.90M 191.10M 219.30M
COGS Growth
+7.59% +6.21% -10.92% +7.10%
Gross Income
2.42B 2.60B 2.90B 3.07B
Gross Income Growth
-14.10% +7.59% +11.39% +5.95%
Gross Profit Margin
+30.25% +30.52% +35.45% +35.21%
2022 2023 2024 2025 5-year trend
SG&A Expense
1.36B 1.46B 1.45B 1.53B
Research & Development
48.80M 47.30M 49.10M 51.70M
Other SG&A
1.31B 1.41B 1.40B 1.48B
SGA Growth
-10.69% +6.96% -0.60% +5.73%
Other Operating Expense
- - - -
-
Unusual Expense
103.50M 12.80M 125.00M 1.84B
EBIT after Unusual Expense
955.50M 1.14B 1.33B (294.80M)
Non Operating Income/Expense
35.50M (1.01B) (81.30M) (376.10M)
Non-Operating Interest Income
- - - -
-
Equity in Earnings of Affiliates
- - - -
-
Interest Expense
147.20M 138.50M 250.70M 375.90M
Interest Expense Growth
-9.86% -5.91% +81.01% +49.94%
Gross Interest Expense
147.20M 138.50M 250.70M 375.90M
Interest Capitalized
- - - -
-
Pretax Income
843.80M (9.20M) 996.40M (1.05B)
Pretax Income Growth
-28.00% -101.09% +10,930.43% -205.06%
Pretax Margin
+10.55% -0.11% +12.18% -12.00%
Income Tax
212.10M 82.10M 252.40M 184.00M
Income Tax - Current - Domestic
240.80M 267.40M 282.80M 280.30M
Income Tax - Current - Foreign
9.20M 5.40M 10.10M 11.70M
Income Tax - Deferred - Domestic
(38.20M) (189.70M) (38.20M) (107.50M)
Income Tax - Deferred - Foreign
300.00K (1.00M) (2.30M) (500.00K)
Income Tax Credits
- - - -
-
Equity in Earnings of Affiliates
- - - -
-
Other After Tax Income (Expense)
(1.80M) 100.00K (200.00K) 100.00K
Consolidated Net Income
629.90M (91.20M) 743.80M (1.23B)
Minority Interest Expense
- - - -
-
Net Income
629.90M (91.20M) 743.80M (1.23B)
Net Income Growth
-27.81% -114.48% +915.57% -265.46%
Net Margin Growth
+7.87% -1.07% +9.09% -14.10%
Extraordinaries & Discontinued Operations
- - - -
-
Discontinued Operations
- - - -
-
Net Income After Extraordinaries
629.90M (91.20M) 743.80M (1.23B)
Preferred Dividends
- - - -
-
Net Income Available to Common
629.90M (91.20M) 743.80M (1.23B)
EPS (Basic)
5.8378 -0.8588 7.145 -11.5667
EPS (Basic) Growth
-25.07% -114.71% +931.97% -261.89%
Basic Shares Outstanding
107.90M 106.20M 104.10M 106.40M
EPS (Diluted)
5.8378 -0.8588 7.1382 -11.5667
EPS (Diluted) Growth
-25.07% -114.71% +931.18% -262.04%
Diluted Shares Outstanding
107.90M 106.20M 104.20M 106.40M
EBITDA
1.52B 1.58B 1.88B 2.05B
EBITDA Growth
-13.05% +4.01% +19.33% +8.57%
EBITDA Margin
+18.98% +18.51% +23.04% +23.44%

Snapshot

Average Recommendation HOLD Average Target Price 108.833
Number of Ratings 19 Current Quarters Estimate 1.879
FY Report Date 07 / 2025 Current Year's Estimate 9.174
Last Quarter’s Earnings 2.31 Median PE on CY Estimate N/A
Year Ago Earnings 10.12 Next Fiscal Year Estimate 9.95
Median PE on Next FY Estimate N/A

Earnings Per Share

This Quarter Next Quarter This Fiscal Next Fiscal
# of Estimates 13 13 14 14
Mean Estimate 1.88 2.38 9.17 9.95
High Estimates 2.28 2.78 10.32 11.01
Low Estimate 1.79 2.24 8.71 9.42
Coefficient of Variance 6.83 5.56 4.03 3.96

Analysts Recommendations

Current 1 Month Ago 3 Months Ago
BUY 4 4 5
OVERWEIGHT 1 1 0
HOLD 13 13 15
UNDERWEIGHT 0 0 0
SELL 1 1 1
MEAN Hold Hold Hold

Insider Actions for The J. M. Smucker Co. - SJM

Date Name Shares Transaction Value
Apr 4, 2025 Tarang P. Amin Director 4,244 Grant, award or other acq pursuant to Rule 16b-3(d) 0.00
Apr 4, 2025 Kirk L. Perry Director 19,144 Grant, award or other acq pursuant to Rule 16b-3(d) 0.00
Apr 4, 2025 Mercedes Abramo Director 3,196 Grant, award or other acq pursuant to Rule 16b-3(d) 0.00
Mar 25, 2025 Jeannette L. Knudsen Chief Legal Officer 14,627 Open market or private sale of non-derivative or derivative security Non-derivative transaction at $110.55 per share 1,617,014.85
Mar 17, 2025 Tucker H. Marshall Chief Financial Officer 13,263 Open market or private sale of non-derivative or derivative security Non-derivative transaction at $113.36 per share 1,503,493.68
Oct 4, 2024 Tarang P. Amin Director 3,737 Grant, award or other acq pursuant to Rule 16b-3(d) 0.00
Oct 4, 2024 Kirk L. Perry Director 18,362 Grant, award or other acq pursuant to Rule 16b-3(d) 0.00

The J. M. Smucker Co. in the News