About toyota motor corp. - TM
TM At a Glance
| Phone | 81-565-28-2121 | Revenue | 336.35B | |
| Industry | Motor Vehicles | Net Income | 25.54B | |
| Sector | Consumer Durables | 2026 Sales Growth | 6.744% | |
| Fiscal Year-end | 03 / 2027 | Employees | 390,927 | |
| View SEC Filings |
TM Valuation
| P/E Current | 8.498 |
| P/E Ratio (with extraordinary items) | N/A |
| P/E Ratio (without extraordinary items) | 10.518 |
| Price to Sales Ratio | 0.799 |
| Price to Book Ratio | 1.07 |
| Price to Cash Flow Ratio | 7.40 |
| Enterprise Value to EBITDA | 11.439 |
| Enterprise Value to Sales | 1.39 |
| Total Debt to Enterprise Value | 0.581 |
TM Efficiency
| Revenue/Employee | 860,385.20 |
| Income Per Employee | 65,322.065 |
| Receivables Turnover | 3.056 |
| Total Asset Turnover | 0.522 |
TM Liquidity
| Current Ratio | 1.274 |
| Quick Ratio | 1.122 |
| Cash Ratio | 0.377 |
TM Profitability
| Gross Margin | 16.699 |
| Operating Margin | 7.431 |
| Pretax Margin | 9.076 |
| Net Margin | 7.592 |
| Return on Assets | 3.962 |
| Return on Equity | 10.398 |
| Return on Total Capital | 4.887 |
| Return on Invested Capital | 6.338 |
TM Capital Structure
| Total Debt to Total Equity | 108.233 |
| Total Debt to Total Capital | 51.977 |
| Total Debt to Total Assets | 40.944 |
| Long-Term Debt to Equity | 64.191 |
| Long-Term Debt to Total Capital | 30.827 |
Toyota Motor Corp. in the News
Toyota recalls 43,500 trucks over engine defect that could cause sudden stall
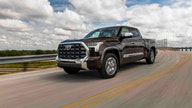
Toyota is recalling more than 43,000 2024 Tundra pickup trucks after federal regulators warned manufacturing debris inside the engine could lead to increased crash risks.

Toyota recalls more than 144,000 Lexus vehicles over rearview camera failure risk
Toyota recalls over 144,000 Lexus vehicles over a rearview camera defect tied to a software issue that may increase crash risk, regulators said.

Toyota recalls 550,000 vehicles over seat defect
Toyota Motor Co. is recalling 550,007 Highlander and Highlander Hybrid vehicles from model years 2021-2024 because of seat-back problems.

Toyota recalls 161K Tundra trucks over rearview camera defect that increases crash risk
Toyota recalls over 161,000 Tundra trucks due to software defect possibly preventing rearview camera display, increasing crash risk, according to federal regulators.

Toyota turns Packers fans' theory about star quarterback Jordan Love into fun promotion during annual event
Packers fans noticed Jordan Love's stellar play during Toyota's annual sales event, leading to a clever "carspiracy" theory that Toyota embraced with special trading cards.
Toyota recalls about 127K pickup trucks, SUVs over potential engine issues
Toyota is recalling 127,000 pickup trucks and SUVs due to engine machining debris that could cause stalling and increase the risk of a crash in affected vehicles.

Toyota recalls over 443,000 trucks for potential reverse light failure
Automaker Toyota is recalling over 443,000 Tundra and Tundra Hybrid trucks over a fault in their reverse light assemblies that could make them stop working.
Toyota to invest over $44M in rocket company
Toyota’s mobility subsidiary plans to make a $44.3 million investment into a Japanese rocket company, Interstellar Technologies, according to a Tuesday announcement.

Toyota follows growing trend of companies halting DEI policies and initiatives
An alleged memo to Toyota employees Thursday said it would stop sponsoring LGBTQ events and begin focusing more on “STEM education and workforce readiness."

Automakers monitoring port strike for impacts on production
The strike by unionized dockworkers at East and Gulf Coast ports has the potential to disrupt auto manufacturers' production due to delayed shipments of auto parts.