under armour inc. - UA

UA

Close Chg Chg %
6.17 -0.02 -0.24%

Closed Market

6.16

-0.02 (0.24%)

Volume: 1.98M

Last Updated:

Jun 5, 2025, 3:59 PM EDT

Company Overview: under armour inc. - UA

UA Key Data

Open

$6.15

Day Range

6.08 - 6.20

52 Week Range

4.62 - 10.62

Market Cap

$2.63B

Shares Outstanding

426.12M

Public Float

117.72M

Beta

1.56

Rev. Per Employee

N/A

P/E Ratio

N/A

EPS

-$0.46

Yield

0.00%

Dividend

N/A

EX-DIVIDEND DATE

SHORT INTEREST

N/A

AVERAGE VOLUME

3.75M


UA Performance

1 Week
 
-2.22%
 
1 Month
 
10.39%
 
3 Months
 
-4.35%
 
1 Year
 
-8.61%
 
5 Years
 
-37.40%
 

UA Analyst Ratings

  • Sell
  • Under
  • Hold
  • Over
  • Buy
Number of Ratings 24
Full Ratings ➔

About under armour inc. - UA

Under Armour, Inc. engages in the development, marketing, and distribution of branded performance apparel, footwear, and accessories for men, women, and youth. It operates through the following geographical segments: North America, EMEA, Asia-Pacific, Latin America, and Other. The company was founded by Kevin A. Plank in 1996 and is headquartered in Baltimore, MD.

UA At a Glance

Under Armour, Inc.
101 Performance Drive
Baltimore, Maryland 21230
Phone 1-410-468-2512 Revenue 5.17B
Industry Apparel/Footwear Net Income -201,267,000.00
Sector Consumer Non-Durables Employees 14,400
Fiscal Year-end 03 / 2026
View SEC Filings

UA Valuation

P/E Current N/A
P/E Ratio (with extraordinary items) N/A
P/E Ratio (without extraordinary items) N/A
Price to Sales Ratio 0.498
Price to Book Ratio 1.341
Price to Cash Flow Ratio N/A
Enterprise Value to EBITDA 10.936
Enterprise Value to Sales 0.65
Total Debt to Enterprise Value 0.387

UA Efficiency

Revenue/Employee 358,726.667
Income Per Employee -13,976.875
Receivables Turnover 7.644
Total Asset Turnover 1.14

UA Liquidity

Current Ratio 2.10
Quick Ratio 1.247
Cash Ratio 0.464

UA Profitability

Gross Margin 47.883
Operating Margin 3.312
Pretax Margin -3.964
Net Margin -3.896
Return on Assets -4.442
Return on Equity -9.955
Return on Total Capital -6.31
Return on Invested Capital -6.255

UA Capital Structure

Total Debt to Total Equity 68.744
Total Debt to Total Capital 40.739
Total Debt to Total Assets 30.214
Long-Term Debt to Equity 61.864
Long-Term Debt to Total Capital 36.661
  • Income Statement
  • Balance Sheet
  • Cash Flow Statement

Annual Financials for Under Armour Inc. - UA

Collapse All in section
All values USD millions. 2021 2023 2024 2025 5-year trend
Sales/Revenue
5.69B 5.86B 5.69B 5.17B
Sales Growth
+27.22% +2.97% -2.81% -9.28%
Cost of Goods Sold (COGS) incl D&A
2.81B 3.26B 3.07B 2.69B
COGS excluding D&A
- - - -
-
Depreciation & Amortization Expense
141.14M 137.62M 142.59M 135.80M
Depreciation
139.14M 135.72M 141.09M 134.40M
Amortization of Intangibles
2.00M 1.90M 1.50M 1.40M
COGS Growth
+20.64% +15.86% -5.81% -12.27%
Gross Income
2.88B 2.60B 2.63B 2.47B
Gross Income Growth
+34.38% -9.62% +0.94% -5.79%
Gross Profit Margin
+50.58% +44.39% +46.11% +47.88%
2021 2023 2024 2025 5-year trend
SG&A Expense
2.33B 2.36B 2.39B 2.30B
Research & Development
- - - -
-
Other SG&A
2.33B 2.36B 2.39B 2.30B
SGA Growth
+8.13% +1.35% +1.32% -3.78%
Other Operating Expense
- - - -
-
Unusual Expense
110.02M 9.20M 5.84M 355.04M
EBIT after Unusual Expense
437.52M 230.10M 226.81M (183.95M)
Non Operating Income/Expense
(2.38M) 70.45M 35.27M (14.73M)
Non-Operating Interest Income
- - - 304.00K
-
Equity in Earnings of Affiliates
- - - -
-
Interest Expense
- 44.26M 12.79M 6.08M
Interest Expense Growth
- -6.27% -71.11% -100.00%
Gross Interest Expense
45.46M 15.89M 6.00M 13.08M
Interest Capitalized
1.20M 3.10M 6.00M 7.00M
Pretax Income
390.88M 287.76M 262.07M (204.76M)
Pretax Income Growth
+179.36% -26.38% -8.93% -178.13%
Pretax Margin
+6.87% +4.91% +4.60% -3.96%
Income Tax
32.07M (101.05M) 30.01M (2.89M)
Income Tax - Current - Domestic
(1.59M) 22.25M 23.97M 16.93M
Income Tax - Current - Foreign
36.30M 29.10M 29.73M 41.97M
Income Tax - Deferred - Domestic
1.50M (159.06M) (22.27M) (53.01M)
Income Tax - Deferred - Foreign
(4.14M) 6.66M (1.42M) (8.79M)
Income Tax Credits
- - - -
-
Equity in Earnings of Affiliates
- - - -
-
Other After Tax Income (Expense)
- - - -
-
Consolidated Net Income
360.06M 386.77M 232.04M (201.27M)
Minority Interest Expense
- - - -
-
Net Income
360.06M 386.77M 232.04M (201.27M)
Net Income Growth
+165.56% +7.42% -40.01% -186.74%
Net Margin Growth
+6.33% +6.60% +4.08% -3.90%
Extraordinaries & Discontinued Operations
- - - -
-
Discontinued Operations
- - - -
-
Net Income After Extraordinaries
360.06M 386.77M 232.04M (201.27M)
Preferred Dividends
- - - -
-
Net Income Available to Common
360.06M 386.77M 232.04M (201.27M)
EPS (Basic)
0.7735 0.8568 0.527 -0.4656
EPS (Basic) Growth
+163.96% +10.77% -38.49% -188.35%
Basic Shares Outstanding
465.50M 451.43M 440.32M 432.25M
EPS (Diluted)
0.7683 0.84 0.5165 -0.4656
EPS (Diluted) Growth
+163.53% +9.33% -38.51% -190.15%
Diluted Shares Outstanding
468.64M 461.51M 451.01M 432.25M
EBITDA
688.69M 376.92M 375.24M 306.89M
EBITDA Growth
+354.49% -45.27% -0.45% -18.22%
EBITDA Margin
+12.10% +6.43% +6.59% +5.94%

Snapshot

Average Recommendation HOLD Average Target Price 7.118
Number of Ratings 24 Current Quarters Estimate 0.026
FY Report Date 06 / 2025 Current Year's Estimate 0.334
Last Quarter’s Earnings -0.08 Median PE on CY Estimate N/A
Year Ago Earnings 0.31 Next Fiscal Year Estimate 0.416
Median PE on Next FY Estimate N/A

Earnings Per Share

This Quarter Next Quarter This Fiscal Next Fiscal
# of Estimates 21 21 22 21
Mean Estimate 0.03 0.27 0.33 0.42
High Estimates 0.05 0.33 0.45 0.60
Low Estimate -0.00 0.21 0.17 0.30
Coefficient of Variance 47.77 11.02 18.88 17.53

Analysts Recommendations

Current 1 Month Ago 3 Months Ago
BUY 5 5 6
OVERWEIGHT 0 0 0
HOLD 15 15 15
UNDERWEIGHT 1 1 1
SELL 3 3 3
MEAN Hold Hold Hold

Under Armour Inc. in the News
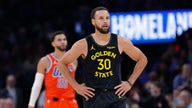
Under Armour paying $9M for SEC probe resolution

Under Armour Inc. agreed to pay $9 million to settle regulatory claims that it failed to disclose that it was pulling forward orders from future quarters, a practice that allowed it to meet Wall Street's revenue estimates.