About yum! brands inc. - YUM
YUM At a Glance
| Phone | 1-502-874-8300 | Revenue | 8.21B | |
| Industry | Restaurants | Net Income | 1.56B | |
| Sector | Consumer Services | 2025 Sales Growth | 8.809% | |
| Fiscal Year-end | 12 / 2026 | Employees | 49,000 | |
| View SEC Filings |
YUM Valuation
| P/E Current | 24.669 |
| P/E Ratio (with extraordinary items) | N/A |
| P/E Ratio (without extraordinary items) | 27.267 |
| Price to Sales Ratio | 5.175 |
| Price to Book Ratio | N/A |
| Price to Cash Flow Ratio | 21.15 |
| Enterprise Value to EBITDA | 19.613 |
| Enterprise Value to Sales | 6.671 |
| Total Debt to Enterprise Value | 0.241 |
YUM Efficiency
| Revenue/Employee | 167,632.653 |
| Income Per Employee | 31,816.327 |
| Receivables Turnover | 8.601 |
| Total Asset Turnover | 1.101 |
YUM Liquidity
| Current Ratio | 1.346 |
| Quick Ratio | 1.346 |
| Cash Ratio | 0.594 |
YUM Profitability
| Gross Margin | 46.165 |
| Operating Margin | 30.898 |
| Pretax Margin | 25.286 |
| Net Margin | 18.98 |
| Return on Assets | 20.893 |
| Return on Equity | N/A |
| Return on Total Capital | 26.586 |
| Return on Invested Capital | 30.446 |
YUM Capital Structure
| Total Debt to Total Equity | N/A |
| Total Debt to Total Capital | 224.915 |
| Total Debt to Total Assets | 160.90 |
| Long-Term Debt to Equity | N/A |
| Long-Term Debt to Total Capital | 222.476 |
Yum! Brands Inc. in the News

Yum Brands sells Pizza Hut for $2.7B, sharpens focus on Taco Bell and KFC
Yum Brands agreed to sell Pizza Hut in a $2.7 billion transaction and approved a new $4 billion buyback authorization while prioritizing KFC and Taco Bell
Yum Brands in talks to sell Pizza Hut to private equity firm: report
Yum Brands is reportedly discussing a potential sale of Pizza Hut to LongRange Capital, a deal that could reshape the restaurant sector amid weaker demand.

Rising gas prices are crushing restaurant sales as $4 a gallon becomes tipping point for consumers
U.S. restaurant chains report weaker than expected sales growth as high gas prices squeeze consumer budgets and force a shift toward value menu offerings.
Pizza Hut to close around 250 locations
Yum! Brands plans to close roughly 250 Pizza Hut locations in the U.S. as part of a broader brand reset, even as the chain continues expanding internationally.
From slump to sizzle: KFC’s recipe for a comeback
KFC reinvents itself by entering the chicken sandwich wars and menu innovation as sales grow amid shifting consumer preferences and rising fast-food competition.

Report ranks top 10 'unhealthy fast-food' chains in the US
A recent report highlights the fast-food nutrition comparison among popular menu combinations at major restaurant chains like Wendy's, Sonic, KFC and others.

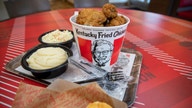
KFC launches bold nationwide comeback plan with free chicken buckets for all customers
Yum! Brands-owned fast-food chain KFC is looking to make a comeback as it rolls out an offer of free buckets of fried chicken and makes some menu additions.

Major fast-food giants unveil secret weapons in summer menu battle
New fast-food menu items have rolled out at widely-popular chains like McDonald's, Chipotle Mexican Grill and Wendy's in recent months, ranging from food to drinks.

Fast-food companies lean into chicken offerings as popularity grows
Fast-food chains such as McDonald's, Taco Bell and Wendy's have each indicated in recent months that they are looking to boost their chicken offerings.

Taco Bell details upcoming new menu items
Yum! Brands-owned chain Taco Bell on Wednesday detailed what menu items fans will see appear on menus this year during its 'Live Mas' event.