Company Overview: domino's pizza inc. - DPZ
DPZ Key Data
| Open $351.20 | Day Range 351.20 - 363.55 |
| 52 Week Range 282.00 - 469.00 | Market Cap $10.66B |
| Shares Outstanding 33.08M | Public Float 32.88M |
| Beta 0.95 | Rev. Per Employee N/A |
| P/E Ratio 20.41 | EPS $17.74 |
| Yield 214.71% | Dividend $1.99 |
| EX-DIVIDEND DATE Sep 15, 2026 | SHORT INTEREST N/A |
| AVERAGE VOLUME 1.00M |
Domino'S Pizza Inc. in the News

Rising gas prices are crushing restaurant sales as $4 a gallon becomes tipping point for consumers
U.S. restaurant chains report weaker than expected sales growth as high gas prices squeeze consumer budgets and force a shift toward value menu offerings.

Potato chip brand unveils biggest redesign in nearly 100-year history
Lay's unveils major rebrand with cleaner ingredients, new logo design, and packaging updates aligning with the "Make America Healthy Again" initiative.
With economic uncertainty, Americans are spending less on fast food
McDonald’s global comparable sales experienced a dip in the first quarter amid consumers weighed down by economic uncertainty buying less fast food.

Domino's Pizza debuts stuffed crust in effort to boost sales
Domino's on Monday announced that customers can now order cheese-filled crust at all U.S. locations, joining the ranks of pizza chains that already offer it.

Domino's manager fired by franchisee for complaining owner hired illegal migrants, lawsuit claims
The former manager of a Domino's location in Connecticut is suing the franchisee he worked for, claiming he was fired for confronting the owner over hiring illegal workers.
Need fast-food? These restaurants are open on Thanksgiving Day 2023
Fast-food restaurants like McDonald's and Starbucks will be open on Thanksgiving Day 2023, as well as chain restaurants including Cracker Barrel, Golden Corral and many more.

Domino's releases new 'emergency pizza' program, offering customers a free medium pizza when most 'needed'
Domino's Pizza has released a new "Emergency Pizza" program for those times when customers need a quick, last-minute bite or have an emergency craving.

Domino’s debuts new pepperoni-stuffed cheesy bread in all US stores
Domino’s, the world's largest pizza company, has announced its newest menu item – pepperoni-stuffed cheesy bread – which launched across all stores in the U.S.
Domino's is electrifying deliveries with hundreds of Chevrolet Bolts
Domino's is buying a fleet of 855 Chevrolet Bolt's from General Motors that will be used by its corporate-owned and franchised locations as delivery vehicles.
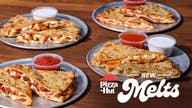
Pizza Hut launches new melty sandwich as pizza pie alternative for solo customers
Pizza Hut has launched a new line of Pizza Hut Melts for solo customers who want a pizza-like meal without committing to an entire pizza pie.