About electrolux ab - ELUXY
Electrolux AB engages in the manufacturing of home and professional appliances. It operates through the following segments: Europe, North America, Latin America, and Asia-Pacific, Middle East and Africa. The company was founded by Axel Wenner-Gren on August 1, 1919, and is headquartered in Stockholm, Sweden.
ELUXY At a Glance
Electrolux AB
Sankt Göransgatan 143
Stockholm, Stockholm 105 45
| Phone | 46-8-738-60-00 | Revenue | 13.43B | |
| Industry | Electronics/Appliances | Net Income | 89.52M | |
| Sector | Consumer Durables | 2025 Sales Growth | 4.2% | |
| Fiscal Year-end | 12 / 2026 | Employees | 40,917 | |
| View SEC Filings |
ELUXY Valuation
| P/E Current | 77.863 |
| P/E Ratio (with extraordinary items) | N/A |
| P/E Ratio (without extraordinary items) | 37.982 |
| Price to Sales Ratio | 0.257 |
| Price to Book Ratio | 3.609 |
| Price to Cash Flow Ratio | 28.53 |
| Enterprise Value to EBITDA | 7.716 |
| Enterprise Value to Sales | 0.481 |
| Total Debt to Enterprise Value | 0.73 |
ELUXY Efficiency
| Revenue/Employee | 328,285.625 |
| Income Per Employee | 2,187.923 |
| Receivables Turnover | 4.82 |
| Total Asset Turnover | 1.115 |
ELUXY Liquidity
| Current Ratio | 0.962 |
| Quick Ratio | 0.658 |
| Cash Ratio | 0.241 |
ELUXY Profitability
| Gross Margin | 19.572 |
| Operating Margin | 1.917 |
| Pretax Margin | 1.378 |
| Net Margin | 0.666 |
| Return on Assets | 0.743 |
| Return on Equity | 9.82 |
| Return on Total Capital | 1.581 |
| Return on Invested Capital | 2.067 |
ELUXY Capital Structure
| Total Debt to Total Equity | 500.00 |
| Total Debt to Total Capital | 83.333 |
| Total Debt to Total Assets | 37.604 |
| Long-Term Debt to Equity | 386.276 |
| Long-Term Debt to Total Capital | 64.379 |
Electrolux Ab in the News
Gas ranges sold at US retailers are being recalled over burn hazard risk
Frigidaire gas ranges are being recalled by Electrolux Group over a delayed ignition burn hazard. The CPSC says about 174,000 units sold in the U.S. and Canada are affected.
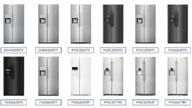
Frigidaire recalling nearly 400K refrigerators because plastic can break off into ice bucket
Electrolux, Frigidaire’s parent company, has received 343 reports of plastic breaking off into the ice bucket and two reports of consumers being cut by the plastic or hurt after ingesting it.