About virgin galactic holdings inc. - SPCE
SPCE At a Glance
| Phone | 1-949-774-7640 | Revenue | 1.54M | |
| Industry | Aerospace & Defense | Net Income | -278,907,000.00 | |
| Sector | Electronic Technology | Employees | 694 | |
| Fiscal Year-end | 12 / 2026 | |||
| View SEC Filings |
SPCE Valuation
| P/E Current | N/A |
| P/E Ratio (with extraordinary items) | N/A |
| P/E Ratio (without extraordinary items) | N/A |
| Price to Sales Ratio | 106.533 |
| Price to Book Ratio | 0.859 |
| Price to Cash Flow Ratio | N/A |
| Enterprise Value to EBITDA | -0.755 |
| Enterprise Value to Sales | 130.444 |
| Total Debt to Enterprise Value | 1.862 |
SPCE Efficiency
| Revenue/Employee | 2,224.784 |
| Income Per Employee | -401,883.285 |
| Receivables Turnover | 0.772 |
| Total Asset Turnover | 0.002 |
SPCE Liquidity
| Current Ratio | 1.781 |
| Quick Ratio | 1.781 |
| Cash Ratio | 1.615 |
SPCE Profitability
| Gross Margin | -5,680.699 |
| Operating Margin | -18,335.039 |
| Pretax Margin | -18,060.557 |
| Net Margin | -18,063.925 |
| Return on Assets | -31.615 |
| Return on Equity | -93.555 |
| Return on Total Capital | -42.981 |
| Return on Invested Capital | -39.776 |
SPCE Capital Structure
| Total Debt to Total Equity | 136.86 |
| Total Debt to Total Capital | 57.781 |
| Total Debt to Total Assets | 46.683 |
| Long-Term Debt to Equity | 116.308 |
| Long-Term Debt to Total Capital | 49.104 |
Virgin Galactic Holdings Inc. in the News

Virgin Galactic raises spaceflight ticket prices to $750K
Virgin Galactic has reopened limited commercial spaceflight sales at $750,000 per ticket, roughly $100,000 above its previous pre-pause list price.

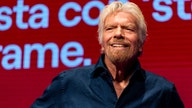
Richard Branson confirms death of wife Joan: 'My best friend, my rock'
Richard Branson announces his wife Joan has died at 80. The Virgin founder called her his 'best friend' and 'guiding light.'
Virgin Galactic cutting jobs, expenses as interest rates bite
Virgin Galactic announced it is laying off an undisclosed number of employees in order to cut costs, saying high interest rates impacted the decision.
Virgin Galactic unveils 3-person crew participating in first private astronaut mission
Virgin Galactic unveiled the identifies of the three individuals that the space company will carry on its Galactic 02 mission next month: Keisha Schahaff, Anastatia Mayers and Jon Goodwin.
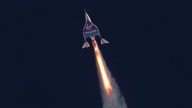
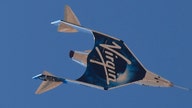
Virgin Galactic looks to the stars with first commercial flight as space wars heat up
Virgin Galactic's suborbital flight will feature three crew members from Italy and is expected to launch on Thursday morning. The company completed its final test flight last month.

Richard Branson says Elon Musk surprised him in his kitchen at 2 AM last year before spaceflight
Richard Branson reflected on his friendship with fellow billionaire and space entrepreneur, saying the SpaceX CEO once surprised him at his house in the middle of the night.
Richard Branson on his upbringing and new 'Branson’ docuseries: ‘I’m incredibly grateful’
Billionaire Richard Branson is releasing a docuseries with HBO detailing his life. "Branson" will be available for streaming on Thursday, and highlights the Virgin Group founder's upbringing.

Virgin Galactic’s commercial service delay sparks downgrade
Shares of Richard Branson's Virgin Galactic have tumbled after the aerospace giant's stock was downgraded from a buy to a hold rating by Truist Securities analyst Michale Ciarmoli.

Virgin Galactic readies spaceflight ticket sales
Virgin Galactic's commercial spaceflights will launch from New Mexico's Spaceport America in the fourth quarter of 2022. A single seat will cost $450,000, with an initial deposit of $150,000.

Nearly half of Americans want space travel but few would pay $100K for it: survey
Apparently, space travel is a popular desire among nearly half of American adults.